


 All stocks
 All Stocks
 52-Week High
 52-Week Low
 AI Companies
 Big Tech
 Death Cross Stocks
 Golden Cross Stocks
 High Beta
 High Dividend
 High Volume
 Highest Cash
 Highest EBITDA
 Highest NET Income
 Highest Revenue
 Largest Employers
 Most Expensive
 Most Volatile
 Tech Companies 2024
 Triangle Patterns Stocks
 All ETFs
 All ETFs
 Energy Sector ETFs
 Major World ETFs
 Top US ETFs
 All Tools
 Alerts
 Technical Signals
 Score
Score
 Smart Portfolio
 Candle and Chart Patterns
A Beginner's Guide to Using the RSI Indicator in Stock Trading

This beginner’s article is your deep dive into the Relative Strength Index (RSI) Indicator. It will explain what RSI is, how it works, and its pros and cons. By its end, you’ll have a deep understanding of how to use it in your stock trading.
What is the RSI Indicator?
The RSI is an oscillator that gauges a stock’s price momentum. That means, it measures the pace and extent of change in a security’s volume. It’s one of the several technical analysis tools developed by J.Welles Wilder Jr and an essential benchmark for entering and exiting trades.
At its core, the RSI seeks to determine how investors perceive a particular stock. Depending on how they value them, these investment vehicles fall into one of three categories. Traders may fairly price them meaning that they believe their real value matches their market price. But they may also undervalue or overvalue them compared to their true worth.
Here’s where the RSI comes in handy. This technical indicator takes the hustle out of stock valuation by pointing out the oversold (undervalued) and overbought (overvalued) securities. It uses a 0-100 scale to summarize investors’ assessment of the asset’s worth at a given time.
How Does the RSI Indicator Work?
Critical to the working of the Indicator is the formula: RSI = 100 – [100 / ( 1 + (Average Price Gain / Average Price Loss ) ) ]. But you needn’t crunch the numbers to get its value(s). You can extract its values from any modern trading chart, such as TradingView and MT4.
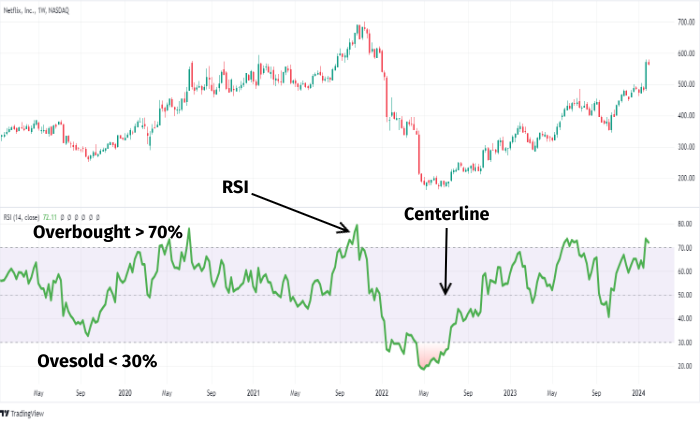
As intimated earlier, the RSI indicator comprises a scale oscillating between 0-100. You can deduce the following stock information from it:
- Oversold position: RSI values here fall between 0 and 30, suggesting that the security is trading below its intrinsic value. Therefore, the asset could be undervalued and likely to rebound.
- Overbought position: Here, the levels lie between 70 and 100, implying the security may be trading above its true value . Consequently, it could be overvalued and set for correction.
- Neutral Position: This level lies between the 30th and 70th marks on the RSI scale. At this point, the stock is neither oversold nor overbought.
The RSI usually analyzes price shifts within 14-day intervals, although it can be tailored to individual preferences. When customized for shorter time frames, it becomes more responsive to price changes but is susceptible to producing false signals. On the other hand, when adjusted for longer durations, it reacts more slowly to price movements, generating fewer false signals but potentially overlooking crucial turning points.
How do I Use the RSI Indicator in Stock Trading?
With the basics of the RSI indicator out of the way, you may wonder how to incorporate it into your stock trading. Here are some practical examples of its usage.
Identifying Buying and Selling Positions
From the following diagram, Points A to E represent overbought positions. These also coincide with rising stock prices, indicating the potential for prices falling and serving as a potential selling point.
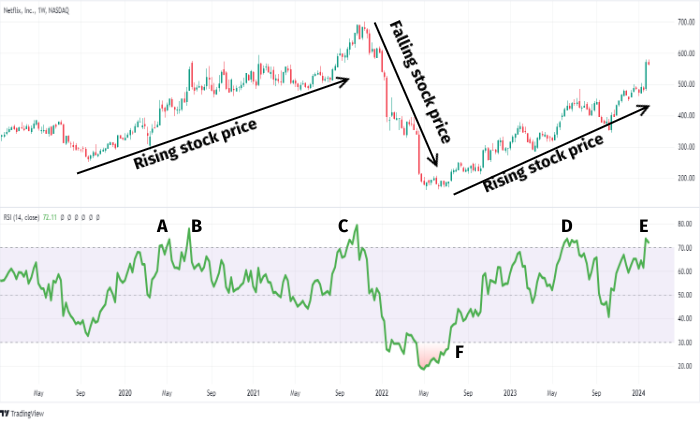
Meanwhile, point F represents an oversold position. The RSI has dipped below the 30 mark, coinciding with the stock’s falling price. That implies a possible rebound hence serving as a potential buying point.
Pinpointing Divergences
A divergence occurs when the security’s price and RSI indicator move in different directions. There are two main types of divergences:
- Bullish Divergence: This happens when the price makes lower lows, but the RSI makes higher lows. It suggests a potential upward reversal, as the price might be weakening while buying pressure is increasing.
- Bearish Divergence: The price makes higher highs, but the RSI makes lower highs. This suggests a potential downward reversal, as the price might be strengthening while selling pressure is increasing.
Significance of RSI Divergence:
- It can provide an early indication of a potential trend change before it reflects in the price itself.
- Traders can use it to confirm other technical indicators like support/resistance levels or chart patterns.
- It can help identify when a trend might be nearing its end.
Locating Failure Swings
Failure swings provide traders with valuable signals indicating potential trend reversals. They are of two types, and are discussed below.
i) Bullish Failure Swings
This happens when the indicator dips deep into the oversold region. It then starts rising again, eventually breaking above the former high. With that, it signals a reversal in the stock’s down-trending prices.
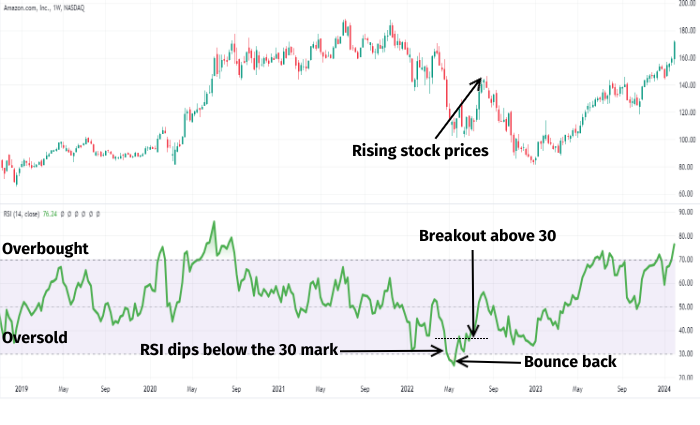
From the graphic, we can see the RSI dropping below the 30 mark. It then bounces back above the value before pulling back again. But it holds above the oversold region and surpasses the earlier high. This indicates a potential stock price breakout and, therefore, a buy signal.
ii) Bearish Failure Swings
In this situation, the RSI first crosses over to the overbought region. Next, it pulls back below the 70 threshold and attempts a bounce back unsuccessfully. In the process, it exceeds the previous low, indicating the continued down-trending of the stock’s price.

From the diagram, we can see the RSI value cut above the overbought level. It tries to pull back towards the 70 mark but falls short mid-course. It then begins descending below the previous low. When this happens, it signals waning momentum and a potential sell opportunity.
What Are The Advantages And Limitations of RSI?
From the preceding discussion, it’s clear that the RSI indicator is an invaluable tool for stock trading. But like any other technical indicator, it isn’t flawless. So, what are some of its upsides and downsides?
Pros
- It’s a versatile tool that readily integrates with other technical indicators for better insights about stocks.
- It helps one to quickly determine the buying and selling signals, thus enhancing stock trading.
- It’s a simple-to-use indicator catering to novices and professionals alike.
- The RSI is a good tool for risk management as it helps identify oversold and undersold conditions.
Cons
- It can generate inaccurate signals during volatile markets as it focuses on recent price movements.
- Being a lagging indicator, the RSI is prone to the effects of past prices, so it can lead to missed opportunities.
- It doesn’t provide the settings behind the oversold and overbought conditions.
- The RSI works best in trending markets, making it unsuitable for ranging and choppy markets.
Conclusion
As you navigate the complexities of stock trading, consider technical indicators like the RSI as valuable tools in your toolkit. However, keep in mind that successful trading often involves a multifaceted approach. While the RSI is a powerful instrument, it’s not a singular solution. By combining its insights with other indicators and strategies, you can elevate your analytical skills and make more informed decisions on your investment journey.
FAQs
What is RSI, and how does it work?
The Relative Strength Index is a momentum indicator measuring the speed and extent of a stock’s recent price changes. It ranges from 0 to 100, with high values (70+) suggesting overbought conditions and low values (0-30) suggesting oversold conditions.
What is a good RSI indicator?
A “good” RSI indicator is subjective, as its effectiveness depends on your trading style, asset, and market conditions.
What are the standard RSI settings?
The default setting for the Relative Strength Index is 14 periods, but day traders often opt for lower periods, typically between 6 and 9. This adjustment aims to increase the frequency of overbought and oversold signals.
How do you use the RSI indicator effectively?
Using the RSI indicator effectively goes beyond looking at the overbought/oversold levels. Consider adapting the levels to the asset you’re trading and the market. Also, watch out for divergences and use other indicators to confirm any signals.
How do you read an RSI signal?
You read signals by comparing the RSI line to its scale readings. An RSI line crossing above the 70 level implies an overbought asset, and its price could be due for a correction. Alternatively, the RSI line crossing below the 30 level signals an oversold asset and a possibility of its price increasing.
Which timeframe is best for the RSI indicator chart?
Your trading style and asset determine the best RSI timeframes to adopt. Whereas shorter timeframes (e.g., 5m) generate more signals, they tend to be noisy. Contrastingly, longer timeframes (e.g., daily) provide fewer but more reliable signals.


Sign up for our newsletter
Join our exclusive community of over one million investment enthusiasts and receive our free newsletter filled with analysis, news, and updates every weekday.