


 All stocks
 All Stocks
 52-Week High
 52-Week Low
 AI Companies
 Big Tech
 Death Cross Stocks
 Golden Cross Stocks
 High Beta
 High Dividend
 High Volume
 Highest Cash
 Highest EBITDA
 Highest NET Income
 Highest Revenue
 Largest Employers
 Most Expensive
 Most Volatile
 Tech Companies 2024
 Triangle Patterns Stocks
 All ETFs
 All ETFs
 Energy Sector ETFs
 Major World ETFs
 Top US ETFs
 All Tools
 Alerts
 Technical Signals
 Score
Score
 Smart Portfolio
 Candle and Chart Patterns
A Guide to Mastering Stock Trading with Moving Averages Indicator

This beginner’s guide is your blueprint for mastering stock trading with the moving averages (MA) indicator. In it, we’ll break down the basics, unveil their different applications, and assess their strengths and limitations. By the end of it, you’ll have the know-how to integrate MAs into your trading strategies, and effectively use them for decision making.
What is a Moving Average Indicator?
The MA is one of the common technical indicators in stock trading. This tool helps stock investors and traders determine the trends in a security’s price. It calculates the equity’s average price over a chosen period, like 50 days, and plots it as a line on your chart.
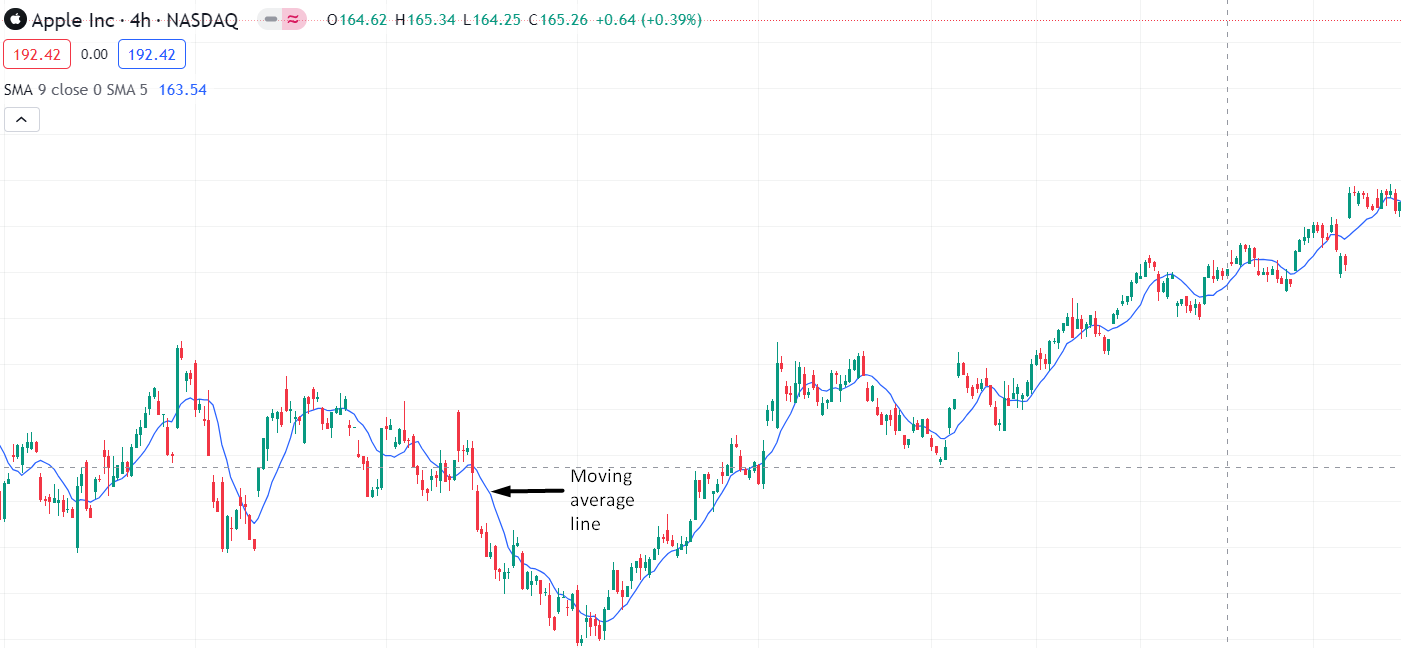
This line depicts the market’s average sentiments regarding the stock over time. Picture the trading chart as a bumpy roller coaster ride and MAs as smoothing filters, ironing out the ups and downs in the equity’s prices to reveal the underlying trend direction.
How do I use the Moving average indicator in stock trading?
Now, with our knowledge in hand, let’s put it into action! Here are some practical ways to use moving averages:
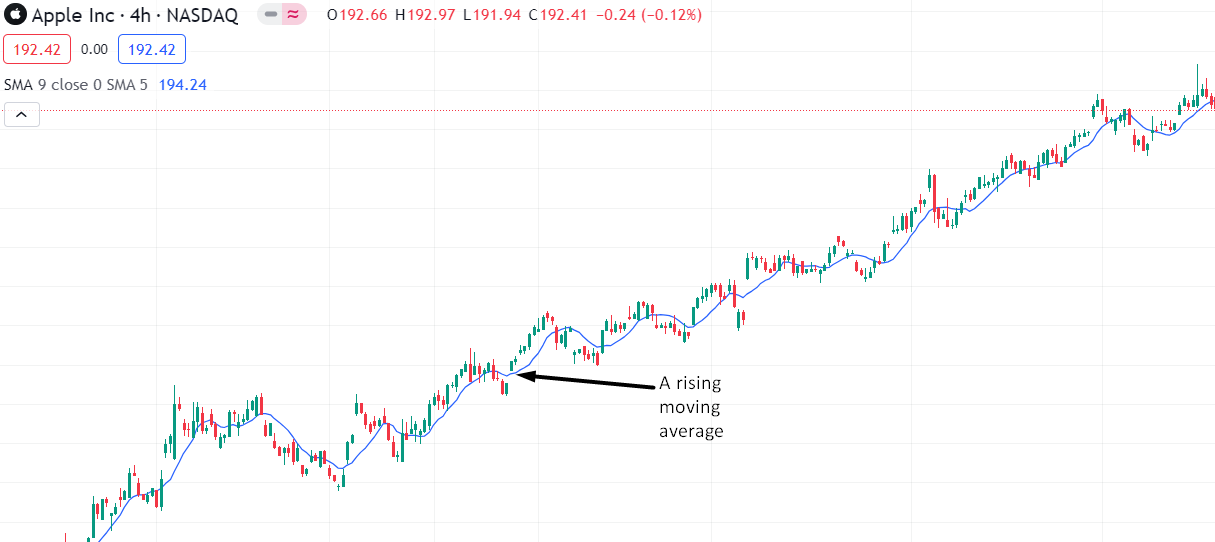
To Identify a Bullish Market
A rising moving average indicates an upward trend, suggesting potential buying opportunities.
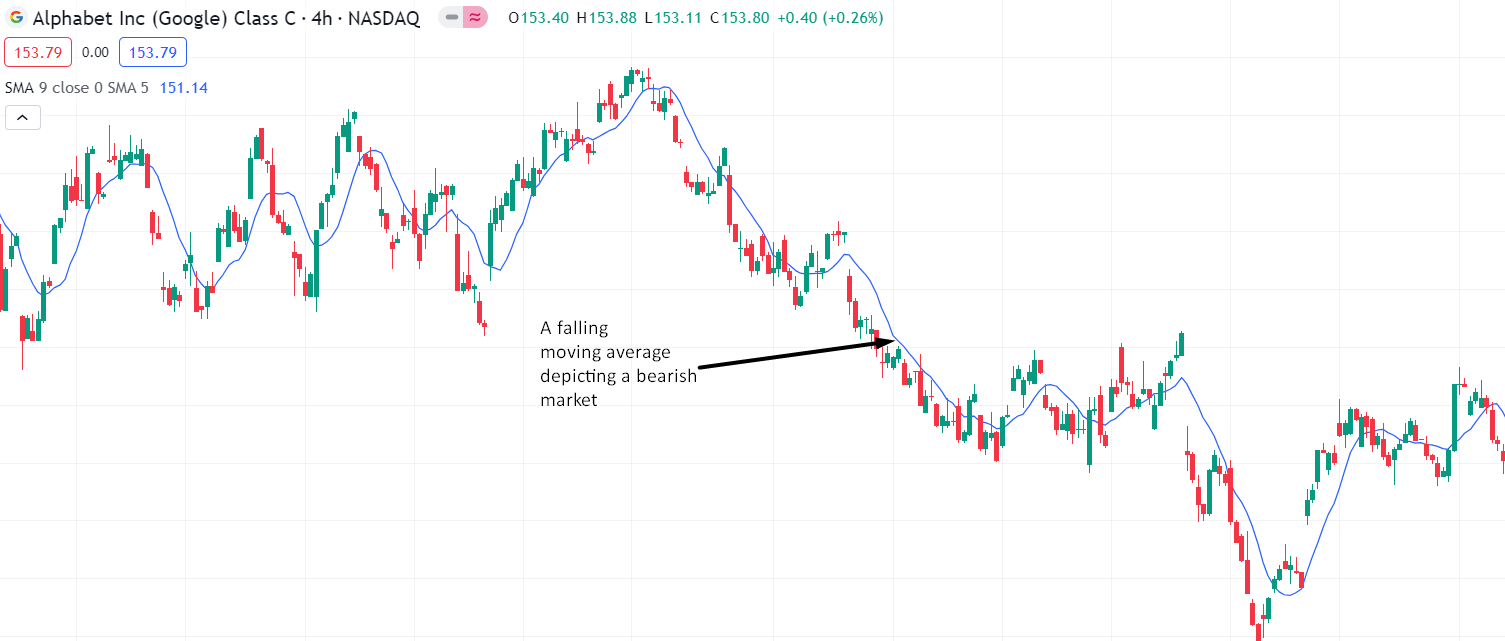
To Identify a Bearish Market
A falling moving average suggests a downtrend, favoring potential selling opportunities.
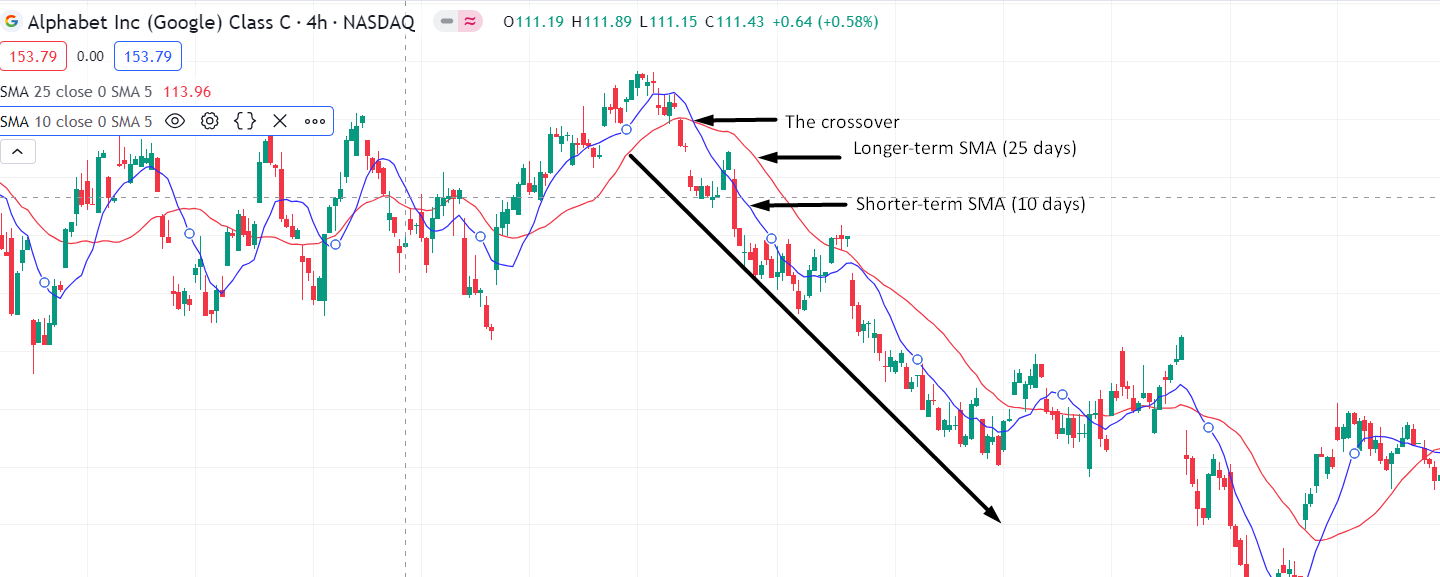
Crossover signals to Identify trend reversals
SMA crossovers are key events in technical analysis that traders use to identify potential changes in trend direction. These crossovers involve the interaction of two Simple Moving Averages (SMAs) with different time periods. Here’s how SMA crossovers are interpreted:
When a shorter-term SMA crosses above a longer-term SMA, it’s considered a bullish signal.
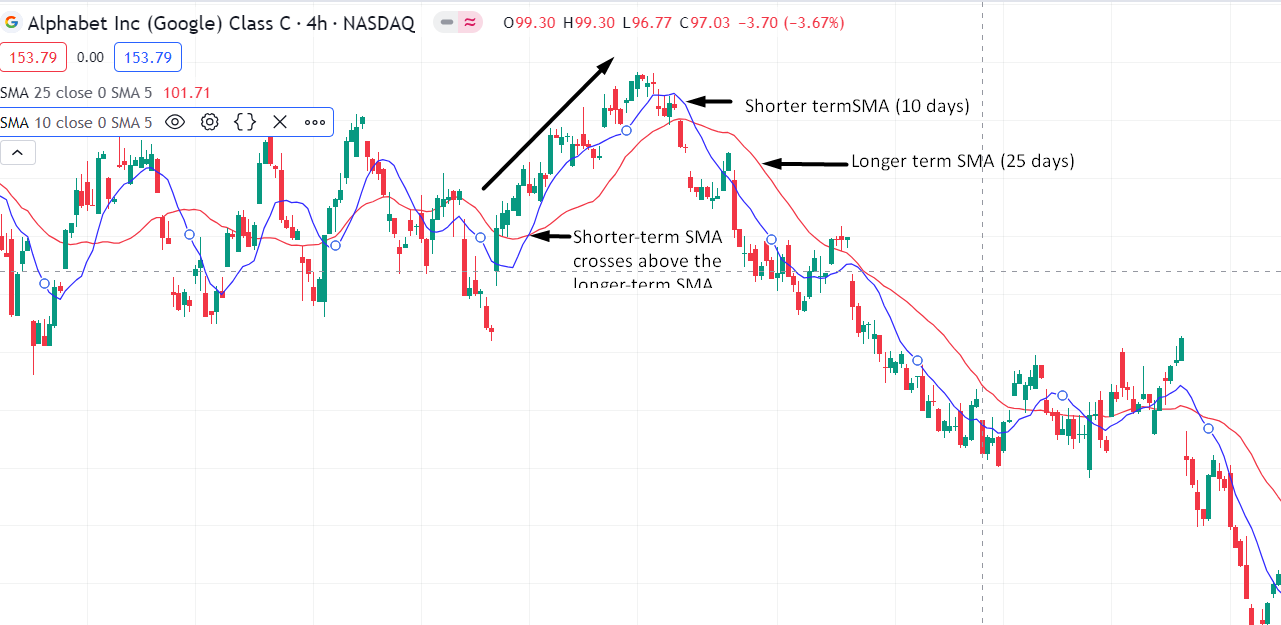
When a shorter-term SMA crosses below a longer-term SMA, it is considered a bearish signal, indicating a potential downward trend.
Pros and Cons of Moving Averages in Stock Trading
From the preceding sections, it’s clear that MAs are trusty trail guides, helping you navigate the often-choppy stock investment terrain. But, like any tool, they have their strengths and weaknesses. Understanding these is vital to using them effectively in your trading.
Pros:
- Simplicity: Moving averages are incredibly easy to understand and use, even for beginners. Their straightforward calculations and visual representation make them accessible to any investor willing to learn.
- Trend Identification: These indicators cut through the market noise, allowing you to see the general direction of a stock’s price over time. This clarity helps you make informed trading decisions.
- Actionable Signals: MAs provide actionable signals for potential entry and exit points in trades. For example, a crossover of a short-term EMA above a long-term SMA can indicate a buying opportunity.
- Risk Management: Integrating MAs into your trading strategy can help you manage risk effectively. For instance, using them to set stop-loss orders.
- Versatility: Moving averages are not limited to a single trading style. Whether you’re a day trader or a long-term investor, you can tailor different moving average types and time frames to fit your goals. This flexibility makes them a valuable tool for a wide range of investors.
Cons:
- Lagging Indicators: It’s important to remember that moving averages are lagging indicators. While they can help identify established trends, they can’t predict future market movements with certainty. This limitation requires cautious interpretation and the use of other tools for confirmation.
- False Signals: Crossovers and bounces off moving averages can sometimes generate false signals, leading to missed opportunities or unprofitable trades. This is especially true in highly volatile markets or when relying solely on moving averages without considering other factors.
- Overreliance: While moving averages are valuable tools, relying solely on them for trading decisions can be risky. Overconfidence in their signals can lead to ignoring other important market information and ultimately result in losses.
- Limited Scope: MAs primarily focus on price trends, not other crucial factors like company fundamentals, industry news, or global economic events. Neglecting these bigger-picture elements can lead to incomplete analysis.
Types of moving averages
There are different types of moving averages, each offering a unique lens on the market. Let’s delve into the most common ones:
Simple Moving Average (SMA):
This technical indicator takes the sum of closing prices over a chosen period (say, 20 days) and divides it by the number of periods. The resulting line winds across your chat, reflecting the average price over that period.
Exponential Moving Average (EMA):
The EMA is a MA that gives more weight to recent prices, making it more responsive to current trends. That makes it ideal for identifying a security’s trends and support and resistance levels. It is handy for short-term traders seeking to capture quick movements.
Weighted Moving Average (WMA):
This MA type assigns higher weights to more recent stock prices while considering older data. The WMA balances recent price movements with historical context, appealing to traders who value agility and stability.
Triangular Moving Average (TMA):
The TMA is like the regular SMA but with a twist. Unlike the SMA, the TMA uses a double smoothing technique. It averages the SMA to generate a smoother price-trend indicator.
Conclusion:
Moving Averages can be powerful tools for navigating the stock market. They can help you identify market trends, entry and exit points, and make informed decisions. But they are not magic wands. So, remember to combine them with technical and fundamental analyses, plus sound risk management practices in your stock trading. Creating a robust strategy for successful and sustainable stock trading. Remember, a holistic approach is the key to unlocking the full potential of your trading endeavors.
FAQ
What is a moving average indicator?
It is a technical indicator that smooths out price data to reveal underlying trends, similar to a compass guiding your path through a jungle.
Which moving average is best for stock trading?
There’s no one-size-fits-all answer. Experiment with different types and timeframes to find what works best for your trading style and risk tolerance.
How do stock traders use a moving average indicator?
Traders use it to identify trends, find support and resistance levels, manage risk, and make informed trading decisions.
How do I set a Moving average for my stock trading?
The way you set moving averages depends on your preferences and trading platform. Most platforms allow you to add and customize moving averages with different periods and types.
How do I add the moving average to my MT4 chart?
In MT4, right-click on your chart, select “Insert Indicator,” choose “Moving Average” from the “Trend” tab, and customize the settings according to your preference.


Sign up for our newsletter
Join our exclusive community of over one million investment enthusiasts and receive our free newsletter filled with analysis, news, and updates every weekday.