


 All stocks
 All Stocks
 52-Week High
 52-Week Low
 AI Companies
 Big Tech
 Death Cross Stocks
 Golden Cross Stocks
 High Beta
 High Dividend
 High Volume
 Highest Cash
 Highest EBITDA
 Highest NET Income
 Highest Revenue
 Largest Employers
 Most Expensive
 Most Volatile
 Tech Companies 2024
 Triangle Patterns Stocks
 All ETFs
 All ETFs
 Energy Sector ETFs
 Major World ETFs
 Top US ETFs
 All Tools
 Alerts
 Technical Signals
 Score
Score
 Smart Portfolio
 Candle and Chart Patterns
Bollinger Bands Mastery: A Practical Guide to Profitable Stocks Trading

Navigating the complexities of the stock market requires mastering various tools, and one such indispensable tool is Bollinger Bands. In this practical guide, we will delve into their intricacies. We will teach you how to master this technical indicator and use it to unlock profitable stock trading strategies. So, without further ado, let’s dive in
What are Bollinger Bands?
Bollinger Bands are a popular technical analysis tool used in stock trading. Created by John Bollinger, these bands consist of three lines:
- A central Simple moving average: This line represents the stock’s average price over a specific period (e.g., 20 days).
- An upper Bollinger Band: This line sits two standard deviations above the moving average, indicating potential resistance levels.
- A lower Bollinger Band: This line sits two standard deviations below the moving average, indicating potential support levels.

The bands dynamically adapt to stock price movements, creating a visual representation of market volatility and potential trading opportunities.
How do you Calculate Bollinger Bands?
Calculating Bollinger Bands involves a three-step process:
1. Calculate the Simple Moving Average (SMA):
- Choose a period, typically 20 days, although you can adjust this based on your preference and the specific stock you’re analyzing.
- Add up the closing prices for the chosen period (e.g., 20 days) and divide by the number of periods.
2. Calculate the Standard Deviation:
- Determine the deviations of each closing price from the SMA calculated in step 1.
- Square these deviations.
- Add up the squared deviations for the chosen period.
- Divide the sum by the number of periods (minus 1 for statistical reasons).
- Take the square root of the result to obtain the standard deviation.
3. Calculate the Upper and Lower Bands:
- Multiply the standard deviation by a chosen factor, typically 2 (although you can adjust it for increased or decreased sensitivity).
- Add the product to the SMA to get the upper band.
- Subtract the product from the SMA to get the lower band.
Here’s a helpful formula to summarize the calculations:
- Upper Band = SMA + (Standard Deviation x K)
- Lower Band = SMA – (Standard Deviation x K)
Where K is the chosen factor, typically 2.
Software and Online Tools:
Most charting software and online analysis platforms will automatically calculate Bollinger Bands for you. Popular options include TradingView, Yahoo Finance, and Google Finance. These tools allow you to input your desired parameters and visualize the Bollinger Bands overlaid on the price chart.
What do Bollinger bands tell you?
Bollinger Bands paint a vivid picture of the market’s current landscape. By observing their interaction with price action, you can glean valuable insights that inform your trading decisions:
- Market Volatility: The width of the bands speaks volumes about volatility. Wide bands signify a turbulent market, where the stock will likely make larger price swings. Conversely, narrow bands indicate a calmer market, suggesting a more stable price range.
- Price Action & Potential Reversals: The interplay between the price and the bands can hint at upcoming trend shifts. When the price touches the upper band for an extended period, it might be nearing an overbought zone, suggesting a potential pullback or reversal. Conversely, a price touching the lower band could signal an oversold condition, hinting at a possible bounce-back.
- Breakouts & Squeezes: When the price decisively breaks above the upper band, it often signals a breakout towards a potential uptrend. Conversely, a break below the lower band could suggest a downtrend. However, be wary of false breakouts, which can occur when the price briefly touches the bands but quickly reverts within their confines. This is where squeezes come in. A significant narrowing of the bands often precedes a breakout, hinting at pent-up energy that could propel the price in either direction.
How to use Bollinger bands in stock trading
The first step in using Bollinger bands is to interpret them correctly. Remember:
- Price touching or crossing the upper band: Indicates potential overbought conditions, suggesting a potential price pullback or reversal.
- Price touching or crossing the lower band: Implies oversold conditions, signalling a potential price rebound or reversal.
- Narrowing bands (Bollinger Squeeze): Indicates low volatility and a potential breakout in either direction.
- Expanding bands: Indicates rising volatility and a continuation of the current trend.
Let’s look at an example to demonstrate how these conditions may play out in stock trading.
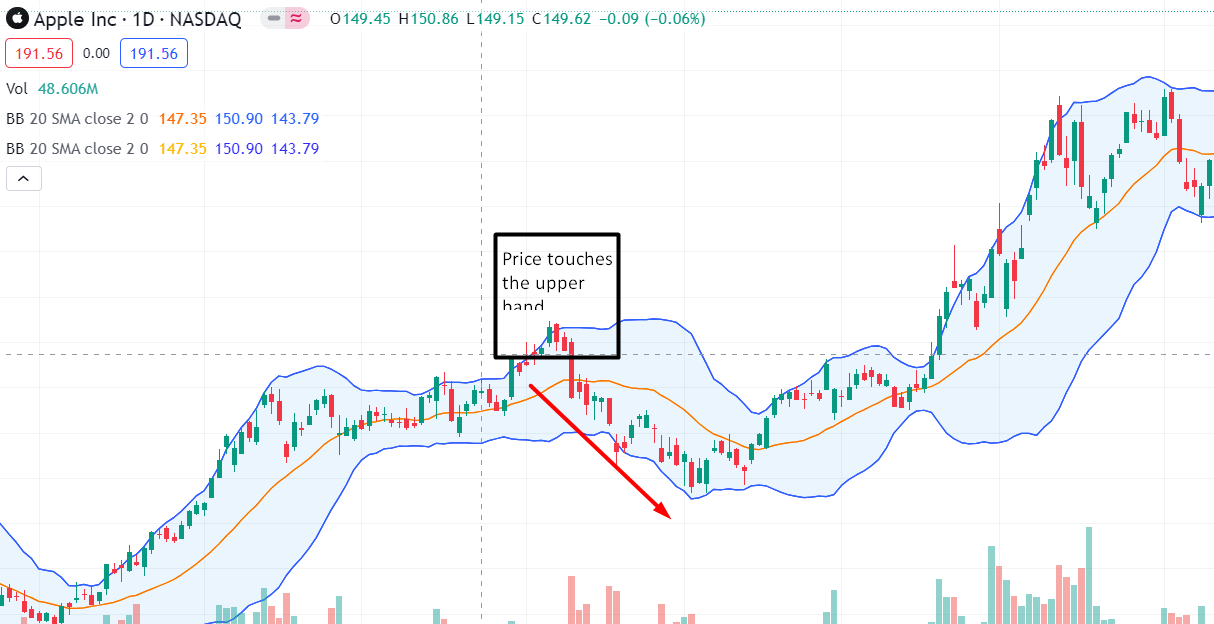
The price touches the upper band:
When the price trades near the upper band, it suggests that the security may be overbought. This implies that the price has experienced significant upward movement, and is possibly due for a pullback or a reversal.
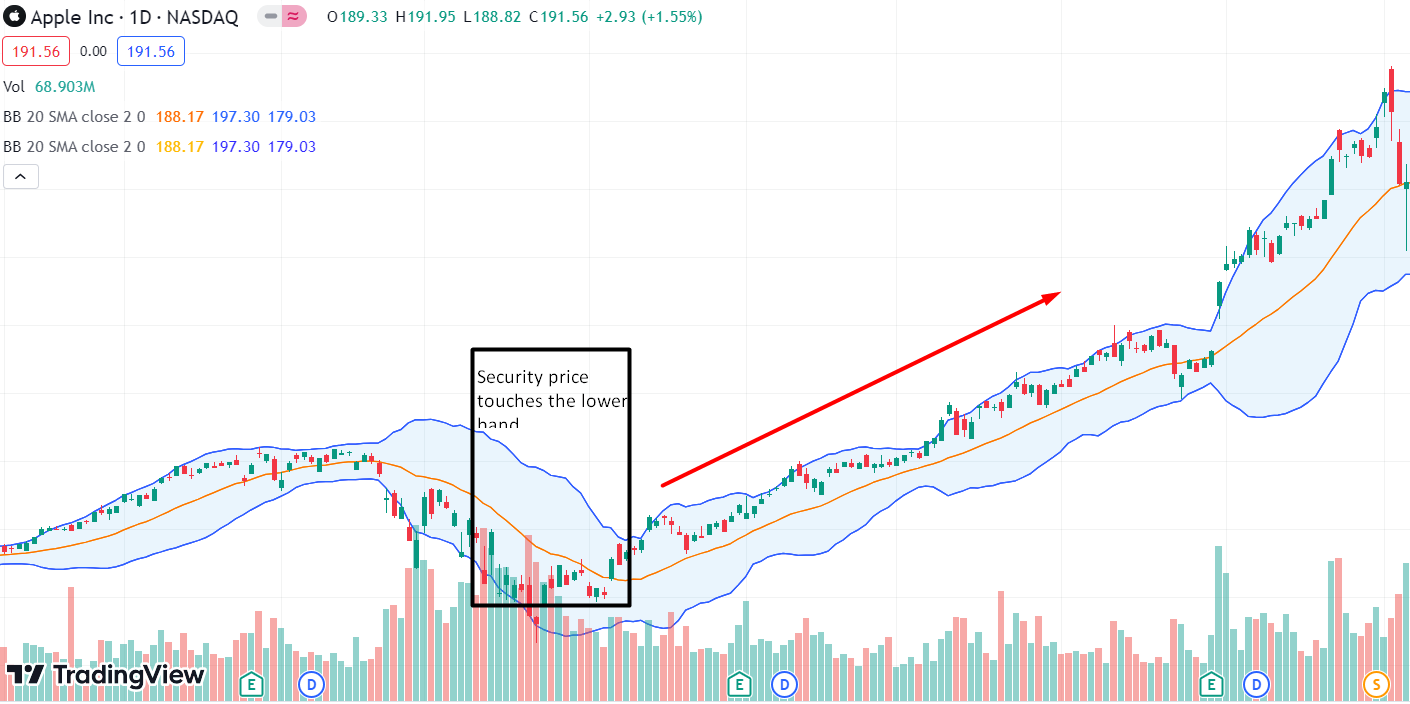
The price bounces off the lower band:
When the price bounces off the lower band of the bollinger indicator, it suggests the security may be oversold. This implies that the security has been experiencing persistent downward pressure, and there is a possibility for an upside bounce back.
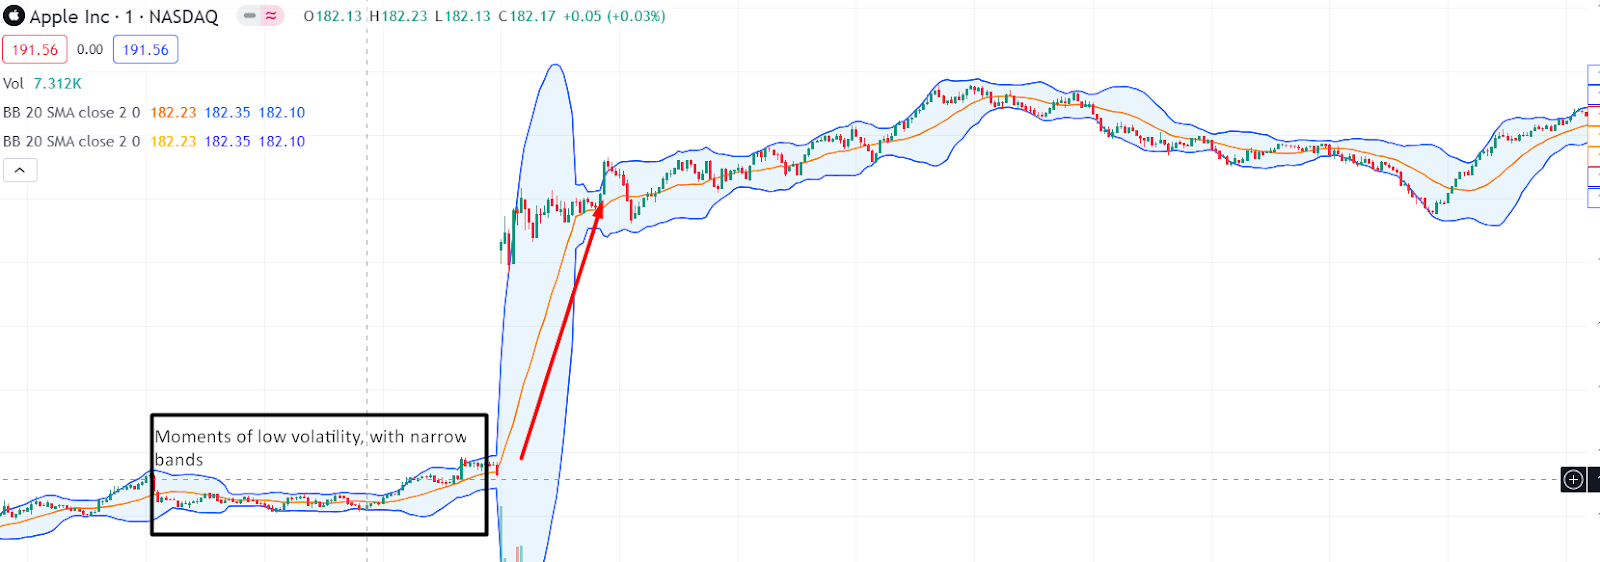
The Bollinger Bands squeeze (Narrowing bands)
A squeeze occurs when the distance between the upper and the narrow bands narrow significantly, indicating periods of low volatility. A squeeze is often interpreted as a precursor to an impending surge in volatility.
Here is how you take advantage of a squeeze opportunity:
Identify a squeeze: Identify periods of low volatility characterized by narrow bollinger bands.
Wait for confirmation: Wait for a breakout above the upper band for a potential bullish move, or a breakdown below the lower band for a potential bearish move.
Factor the Volume: A surge in volume as the price breaks out of the squeeze can add confidence to the signal.
Bollinger Band settings
The “best” settings for Bollinger Bands depend on your trading style, risk tolerance, and the specific stock you’re analyzing. The standard 20-day moving average and two standard deviations are a popular starting point, but feel free to experiment to find what works best for you:
- Moving Average Length: Shorter lengths (e.g., 10 days) react faster to price changes, making them suitable for day trading or capturing short-term trends. Longer lengths (e.g., 50 days) offer a smoother trendline and are better suited for swing trading or identifying longer-term trends.
- Number of Standard Deviations: More deviations (e.g., three) create wider bands, indicating higher volatility and potential for larger swings. This setting might be preferable for capturing breakout trades in volatile markets. Fewer deviations (e.g., one) create tighter bands, reflecting lower volatility and potentially smaller price movements. This setting might be suitable for trend-following strategies in stable markets.
Limitations of Bollinger Bands
Remember, Bollinger Bands are not a magic formula for guaranteed success. Like any tool, they have limitations and require mindful usage:
- False Signals: Breakouts and squeezes can sometimes be misleading, leading to false entries or exits. Always use confirmation from other technical indicators and your trading plan before executing trades based on Bollinger Bands signals.
- Lagging Indicator: Bollinger Bands react to past price movements, so they might not capture sudden changes in market sentiment. That’s why you should use them as part of a broader technical analysis approach, incorporating other indicators that can provide real-time insights.
- Subjectivity: Personal biases in setting adjustments can affect their accuracy and validity
Getting Started with Bolinger Bands
As a beginner, here are some practical tips to get started with Bollinger Bands:
- Start by understanding the basics: Familiarize yourself with the components and how they interact with price action. Utilize online resources and tutorials to gain a solid foundation.
- Practice on paper or with a demo account: Experiment with different Bollinger Band settings and strategies in a simulated environment before risking real capital. This allows you to develop your skills and gain confidence without financial repercussions.
- Combine Bollinger Bands with other indicators: Don’t rely solely on them. Use them with other technical indicators for a more comprehensive analysis and to confirm trading signals.
- Backtest your strategies: Before deploying any strategy in real-time, test it on historical data to assess its effectiveness and identify potential weaknesses.
- Manage your risk: Always have a risk management plan, including stop-loss orders to limit potential losses. Remember, even the best tools cannot guarantee success, so prioritize responsible trading practices.
Conclusion
Mastering Bollinger Bands unlocks a powerful tool for navigating the stock market’s complexities. By understanding their components, signals, and optimal settings, traders can enhance their decision-making process and strive for profitable outcomes. Remember, while they provide valuable insights, a holistic approach to technical analysis is key to successful stock trading.
FAQ
What do Bollinger bands tell you?
Bollinger Bands provide insights into market volatility, potential trend reversals, and overbought/oversold conditions.
When should I buy Bollinger bands?
There’s no one-size-fits-all answer, but potential buying opportunities might arise during Bollinger Band squeezes or when the price bounces off the lower Bollinger Band.
What are the best settings for Bollinger bands?
The standard settings are a good starting point, but you can experiment with different moving average lengths and standard deviations to find what works best for your trading style.
How accurate are Bollinger bands?
Bollinger Bands offer volatility insights and potential breakout signals, but their accuracy depends on market context, interpretation, and combining them with other tools. Think of them as a helpful guide, not a guaranteed roadmap.
What indicator can I pair with Bollinger bands?
Popular pairings include the Relative Strength Index (RSI), Moving Average Convergence Divergence (MACD), and support/resistance levels.


Sign up for our newsletter
Join our exclusive community of over one million investment enthusiasts and receive our free newsletter filled with analysis, news, and updates every weekday.