


 All stocks
 All Stocks
 52-Week High
 52-Week Low
 AI Companies
 Big Tech
 Death Cross Stocks
 Golden Cross Stocks
 High Beta
 High Dividend
 High Volume
 Highest Cash
 Highest EBITDA
 Highest NET Income
 Highest Revenue
 Largest Employers
 Most Expensive
 Most Volatile
 Tech Companies 2024
 Triangle Patterns Stocks
 All ETFs
 All ETFs
 Energy Sector ETFs
 Major World ETFs
 Top US ETFs
 All Tools
 Alerts
 Technical Signals
 Score
Score
 Smart Portfolio
 Candle and Chart Patterns
Stochastic Oscillator: A Beginner's Guide to its Principles and Applications

One of the technical indicators you’ll meet in your stock trading journey is the Stochastic Oscillator. While the term can be a mouthful, it’s one of the simplest metrics to understand for momentum trading as a beginner.
This guide will explain what the Stochastic Oscillator is. It will equip you with the know-how to use it to identify overbought and oversold conditions. Additionally, we will show you how to utilize it in your day to day trading.
What is the Stochastic Oscillator?
The Stochastic Oscillator is a momentum-based technical indicator. It compares a stock’s closing price to its recent price range – specifically, a set period like the past 14 days. Imagine it as a speedometer visualizing if the stock has been gaining bullish steam or facing bearish pressure.
This technical indicator comprises two line graphs and a scale ranging from 0 to 100. The first is the %K line (fast line), which is more sensitive to price movements. The second one is the %D line (slow line) and is a 3-day simple moving average of the fast line.
On both ends of the oscillator are the overbought and oversold territories. The former conditions occur when the indicator surpasses the 80% threshold, suggesting that prices may be due for a pullback. Conversely, oversold conditions appear below the 20% threshold, indicating potential price bounce back.
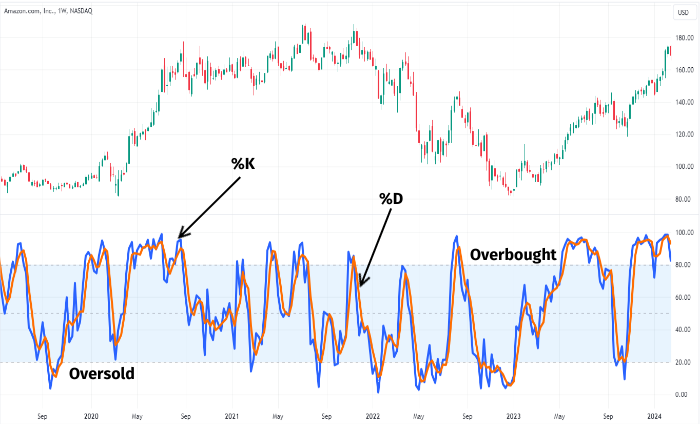
Above is a graphic representation of the Stochastic Oscillator. From it, you can discern the %K line is in blue and the %D line is in orange. You can also see the indicator’s scale on the right and the overbought and oversold territories.
How Do You Calculate The Stochastic Oscillator?
The Stochastic Oscillator is widely available on charting platforms. For beginner-friendly platforms like MetaTrader 4 and cTrader, it’s under the ‘Oscillators’ indicators section. Play around with default settings, then tweak parameters as you get familiar.
However, should you choose the second option, here’s a formula to help you along:
- %K = (Current Close – Lowest Low of Past 14 Periods) / (Highest High of Past 14 Periods – Lowest Low of Past 14 Periods) * 100
- %D = A 3-day simple moving average of %K
Let’s simplify this with an example. Assume a stock’s current closing price is $50, its 14-day low was $40, and the 14-day high was $60.
- %K = ($50 – $40) / ($60 – $40) * 100 = 50
A %K reading of 50 suggests the price is right at the midpoint of its recent range. Since %D is just an average of %K, it provides a smoother line than the faster-reacting %K.
Using the Stochastic Oscillator in Stock Trading
You can enhance your decision-making by incorporating the Stochastic Oscillator into your trading strategy. Here are some ways of using it to better your stock investment journey.
Crossovers:
These happen when the two lines cut each other, and are of two types: bearish and bullish.
Bearish Crossover
A bearish crossover occurs when the %K and %D lines cross into the overbought territory. Then, they start falling towards the oversold region, with the former crossing under the latter, as the following chart shows.
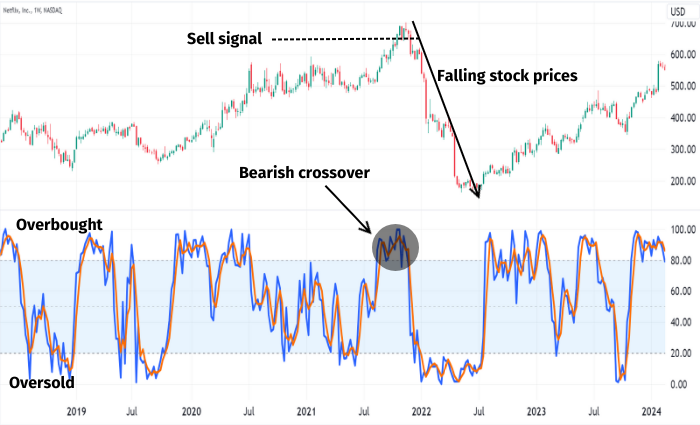
The circled area represents a bearish crossover. We can see the two lines intersecting, then the fast crossing under the slow one. That coincides with a continued fall in the stock’s price, suggesting the bears are controlling the market. You may consider exiting your long positions or going short.
Bullish Crossover
This type of crossover occurs when the fast and slow lines interact within the oversold region. The latter crosses above the former and moves towards the overbought region faster. We can show that information graphically as follows.
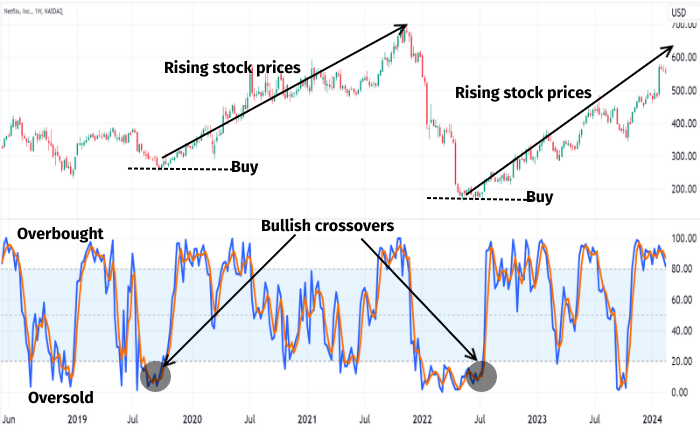
The two circles represent bullish crossovers. In both instances, the %K line cuts above the %D line while maintaining an upward trend. At the same time, the stock experiences a continued rise in its price indicating a bullish run. This is a good entry point for long positions.
Divergence:
Divergence trading, a popular strategy, involves spotting discrepancies between price action and the Stochastic Oscillator. A bullish divergence occurs when prices make lower lows, but the Stochastic Oscillator forms higher lows, signaling a potential upward reversal. Conversely, prices make higher highs in bearish divergence, but the Stochastic Oscillator forms lower highs, indicating a possible downward reversal.
Combining with Other Indicators
While the Stochastic Oscillator is a powerful tool, combining it with other indicators can amplify its effectiveness. Relative Strength Index (RSI) and Moving Average Convergence Divergence (MACD) are popular choices for complementing its analysis. Cross-referencing signals from multiple indicators allows traders to validate their findings and make more informed trading decisions.
What Are The Pros and Cons of The Stochastic Oscillator?
The Stochastic Oscillator is a vital technical analysis tool for many stock investors. But it isn’t infallible. So, understanding its strengths and weaknesses helps traders use it more effectively. Here’s a breakdown of its pros and cons:
Pros
- It is a good signal for overbought or oversold securities, enabling traders to determine possible entry and exit points.
- The Oscillator’s momentum focus makes it handy in spotting trend reversals or changes.
- Traders can use it to confirm trends in stock prices and possibly time their entries and exits.
Cons
- Like many indicators, the Stochastic Oscillator can be prone to false signals, especially in choppy or sideways markets.
- It is a lagging indicator and could lead to late entries or exits.
- The oscillator can produce whipsaws when the underlying asset isn’t in a well-defined trend.
How to Mitigate its Limitations
- Use it with other technical indicators and price action analysis for confirmation.
- Consider using it in trending markets where it’s more reliable and other indicators for sideways conditions.
- Pay attention to divergences, which may signal a potential price reversal.
Conclusion
The Stochastic Oscillator offers beginners a simple yet effective way to understand market momentum in the stock market. Learning to use it can enhance your decision-making process. While not the only tool you’ll need, its versatility makes it a valuable addition to your trading strategy.
FAQs
Which time frame is best for a stochastic oscillator?
There’s no single “best” time frame for the stochastic oscillator as its effectiveness depends on your trading goals and the specific market you’re analyzing.
What does K and D mean in stochastic?
%K is the oscillator’s main line and reflects the current market momentum. It compares the stock’s current closing price to the range over the specified time frame. Meanwhile, %D is a moving average of the %K line, acting as a signal line.
How do I combine MACD and stochastic?
You can use the MACD with the Stochastic indicator to confirm divergences/convergences, overbought/oversold positions, and filter trends.
Which oscillator is best for trading?
Determining the best oscillator is highly subjective. The right choice will depend on your trading style, the assets you prefer, and the prevailing market trends.


Sign up for our newsletter
Join our exclusive community of over one million investment enthusiasts and receive our free newsletter filled with analysis, news, and updates every weekday.