


 All stocks
 All Stocks
 52-Week High
 52-Week Low
 AI Companies
 Big Tech
 Death Cross Stocks
 Golden Cross Stocks
 High Beta
 High Dividend
 High Volume
 Highest Cash
 Highest EBITDA
 Highest NET Income
 Highest Revenue
 Largest Employers
 Most Expensive
 Most Volatile
 Tech Companies 2024
 Triangle Patterns Stocks
 All ETFs
 All ETFs
 Energy Sector ETFs
 Major World ETFs
 Top US ETFs
 All Tools
 Alerts
 Technical Signals
 Score
Score
 Smart Portfolio
 Candle and Chart Patterns
Turbocharging Stock Trading with the Average Directional Index (ADX)

Judging the momentum and direction of price movements is vital to successful stock trading. You have different technical indicators for that, but one that stands out is the Average Directional Indicator (ADX). This guide takes you through the fundamentals of the ADX indicator. It will provide you with the knowledge and practical skills to enhance your stock trading with this tool.
What is the Average Directional Index Indicator?
The Average Directional Index is a technical indicator that gauges the intensity of a security’s price trend. It is the brainchild of Welles Wilder, who developed it specifically to analyze market swings in commodities. However, it has applications in many other areas, including stock trading.
ADX is a single-line oscillator that depicts the trendiness of a stock’s price. It is a smoothed average of two other indicators, the positive directional indicator (+DI) and the negative directional indicator (-DI). Nevertheless, the ADX is non-directional.
That’s to say that it doesn’t differentiate between uptrends and downtrends. Instead, it only spells the equity’s price momentum. Central to its functioning is a 0 to 100-calibrated scale showing the extent of the stock’s price shifts.
The following is a graphical depiction of the three lines.
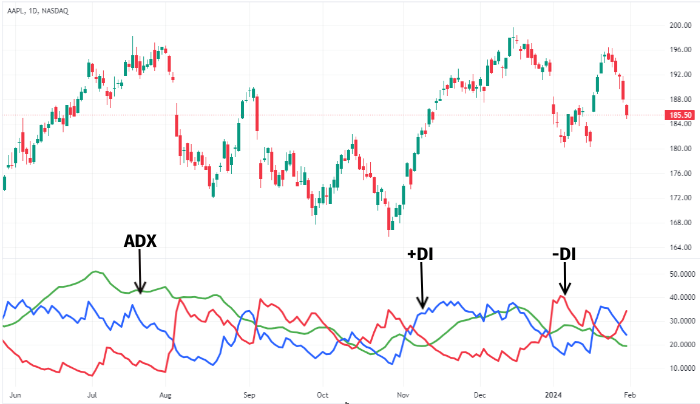
As you can see, the green line represents the ADX, the blue is the +DI, and the red is the -DI. Above them are the candlesticks depicting price movements.
Decoding ADX Signals
The ADX is only as effective as you use it. So, to successfully integrate it into your stock investing, you need a thorough grasp of its signals. As already stated, the ADX reveals the price momentum when used alone. But in conjunction with the +DI and -DI indicators, it shows the direction of those movements.
Interpreting Momentum
ADX readings provide meaningful insights into the depth of the security’s prevailing price trend. Any reading under 20 implies the absence of any discernible trend, while between 20-25 means there’s an emerging trend.
Moreover, you can conclude that there’s a strong trend with an ADX reading of 25-50. On the other hand, a solid trend is visible, with ADX values ranging from 50-70. Lastly, a power trend is discernible with readings above 70, a rare situation.
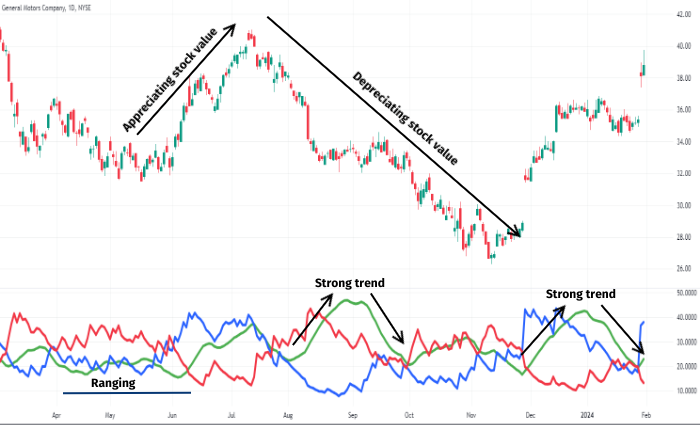
From the image, we can tell that sharp rises and falls in the ADX index show strong trends. Alternatively, gradual rises and falls in the metric indicate weak trends. And when the +DI and -DI values are relatively even, then the stock price is ranging as shown.
Understanding Trend Directions
The behavior of +DI and -DI lines reveals the direction the stock is trending towards. You’ll observe an uptrend whenever the +DI line lies above the -DI one. Conversely, the price is experiencing a downtrend when the -DI line is above the +DI line.
Additionally, their intersection discloses the market sentiment. A Crossing of the directional indicators indicates that a trend reversal is in the offing. Meanwhile, a bullish trend emerges when the +DI line cuts above the -DI line, and the opposite is true for a bearish trend.
How do I Use ADX in Stock Trading?
By now, you have a good grasp of the ADX indicator and how it works. Let’s then shift our attention to how you can use it in stock trading:
Determining Buy Positions
The ADX is an essential tool in determining entry or buying positions. As stated earlier, an ADX value of 25 or more indicates a strong price momentum. That and a crossover where the +DI line cuts above the -DI one signals a bullish trend, hence an opportunity to buy a particular stock.
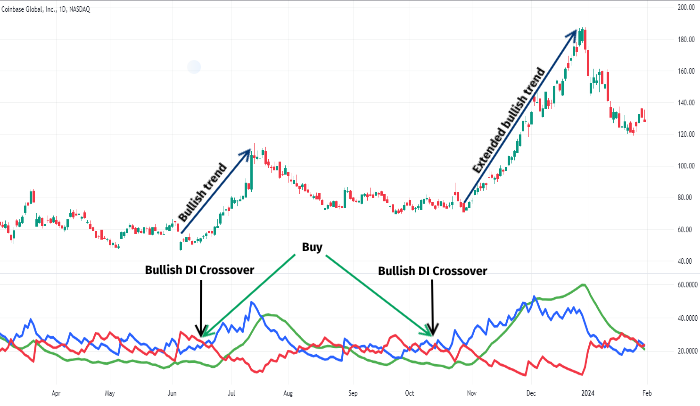
The diagram above shows bullish DI crossovers at the selected points. Besides the +DI line crossing above the -DI line, the ADX is above 25. That indicates increasing buying pressure, as shown by the steep ascent in the candlestick pattern.
Establishing Sell Positions
When the -DI line cuts above the +DI line, and the ADX signals a strong downtrend, it indicates prevailing bearish conditions. As such, that would be the opportune time to enter a sell order, or exit your long positions.
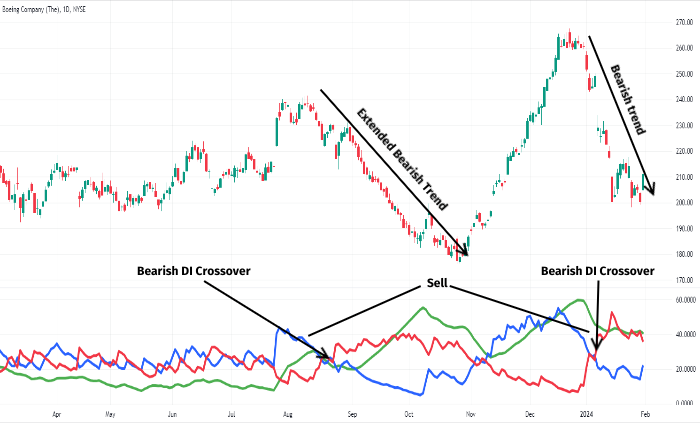
Looking at the chart above, we can see that the -DI line crosses above the +DI one at the marked points. This is happening when the ADX index is showing strong momentum (above 25), presenting the right opportunity for a sell order.
Discovering Ranges
The ADX is an invaluable tool for determining price ranges. A prolonged stay below the 25 value level signals a ranging market, where prices swing between supports and resistances. You can place your buy orders off the supports and sell orders on resistances.
Advantages and Disadvantages of ADX
Though an invaluable tool in stock trading, the ADX isn’t foolproof. So, it’s important to use it cautiously. Here is a selection of its advantages and disadvantages.
Pros
- The indicator helps identify the momentum of price movements, which is key in determining entry and exit points in stock trading.
- The ADX complements other technical indicators like OBV, RSI, and Parabolic SAR for a sweeping view of the stock market.
- It helps to validate breakouts by comparing the stock price to its slope.
- It eliminates directional biases inherent in other kinds of technical indicators.
Cons
- The ADX is a lagging indicator and can disadvantage investors from certain trades.
- It only works best in trending market conditions and may generate false signals for other market conditions.
- ADX only provides price momentum information, necessitating its use with other indicators and company analyses for a broader market view.
- Using it together with the directional indicators obscures its readings and possible interpretation.
Conclusion
The ADX can be an invaluable tool in stock trading when used correctly. Used together with the directional indicators and the price chart, it helps investors tell the intensity and direction of price movements. That said, it has its shortcomings, requiring its cautious use. Investors are advised to leverage its strengths while remaining mindful of its constraints
FAQS
What is a good Average Directional Index?
What makes a good ADX is subjective. Nevertheless, the common consensus is that an ADX reading of 25 and above signals a strong trend.
What does the ADX indicator tell you?
The ADX is primarily a price momentum indicator. That’s to say, it shows the intensity of a security’s price swings. But used together with the directional indicators, it can reveal where the stock price is trending towards.
How do you calculate the Average Directional Index?
Calculating the ADX involves finding the directional movement index value and then smoothing that over a set period. Typically, the smoothing uses 14 periods, but you may tailor that to your liking.
How do I trade with ADX?
There are various strategies for using ADX in stock trading. But fundamentally, you use the indicator to determine the stock’s price momentum and direction. Then, match this information with the price action, and you’ll decide your entry and exit points.


Sign up for our newsletter
Join our exclusive community of over one million investment enthusiasts and receive our free newsletter filled with analysis, news, and updates every weekday.